Compare home prices at your own pace.
Median asking prices for one to five bedroom homes across 34 cities in England and Wales, with price per square foot, 12-month movement and time to offer alongside — so a low price is easy to tell apart from a genuinely good deal.
Where each home size costs least
Ranked across 13 cities in Southern England. The default is lowest purchase price, with overall value weighing price per square foot, 12-month movement and time to offer together.
- 01PlymouthSouth West · 14 listings£207,500£258+152.1%212d£258/sq ft+152.1%212d
- 02Milton KeynesSouth East · 10 listings£227,500£320+219.9%170d£320/sq ft+219.9%170d
- 03SouthamptonSouth East · 14 listings£245,000£338+92.3%241d£338/sq ft+92.3%241d
- 04NorwichEast of England · 12 listings£270,000£350+137.3%214d£350/sq ft+137.3%214d
- 05ExeterSouth West · 10 listings£272,500£387+102.5%165d£387/sq ft+102.5%165d
- 06BristolSouth West · 19 listings£315,000£452+5.6%0d£452/sq ft+5.6%0d
- 07BrightonSouth East · 12 listings£383,500£496+219.8%45d£496/sq ft+219.8%45d
- 08OxfordSouth East · 13 listings£386,000£581+61.7%14d£581/sq ft+61.7%14d
- 09CambridgeEast of England · 17 listings£400,000£543+52.3%21d£543/sq ft+52.3%21d
- 10BathSouth West · 21 listings£446,000£541+47.1%0d£541/sq ft+47.1%0d
England & Wales by value and momentum
Every region shaded by average recorded price — or switch to 12-month change to see where values are cooling and where they are still climbing.
Boundaries: ONS. Contains OS and National Statistics data © Crown copyright and database right 2026.
National median asking price
Cities repricing
A falling market is where a low asking price becomes a low purchase price.
Monthly price movement by region
Twelve months of recorded sales by English region and Wales. Pick any combination to see where prices are easing and where they are still climbing.
HM Land Registry UK House Price Index · average price of all property types, last 11 months.
Where the market is heading
A region repricing down is where today's asking price becomes tomorrow's bargain; one holding up is where rental demand usually follows.
- London£554,430 average-2.2%
- South East£379,953 average-0.8%
- North East£165,640 average+3.2%
- Wales£216,363 average+3.1%
- North West£220,393 average+2.2%
Fresh to the market
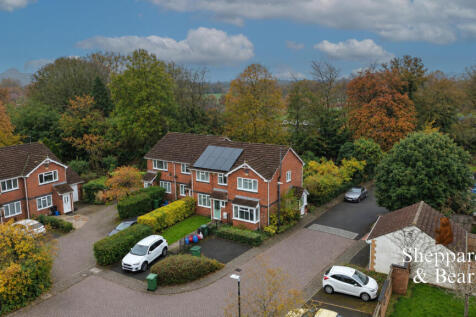 Rightmove
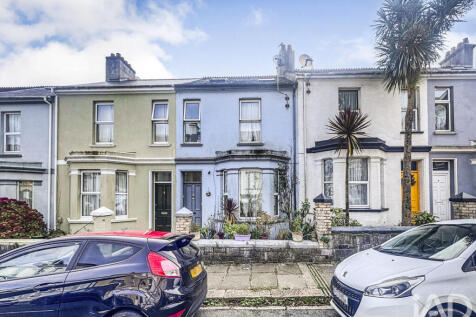 Rightmove
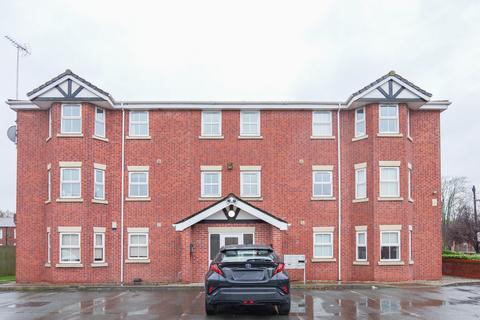 OnTheMarket
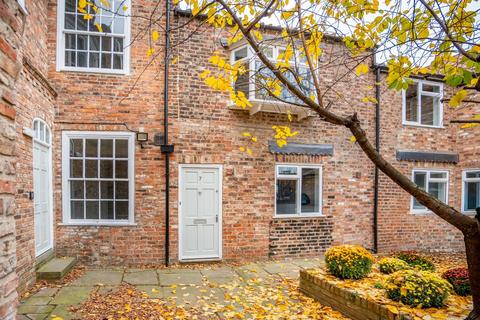 OnTheMarket
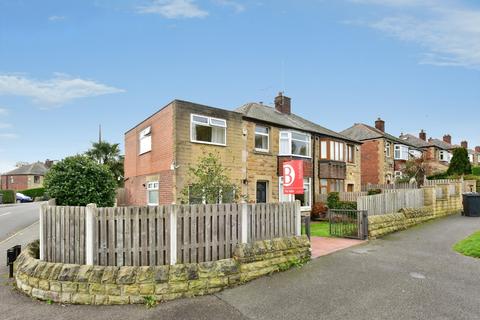 OnTheMarket
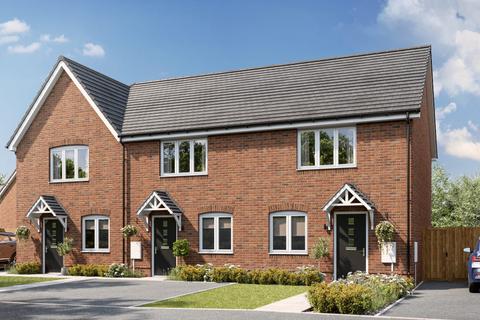 OnTheMarket
Live data sources
Every refresh pulls completed sales from the HM Land Registry Price Paid open API — free, no key, 34 districts over the last 12 months — and live asking prices from Rightmove and OnTheMarket for every city. Sold prices are actual completions, so they carry more weight than asking prices.
5097 recorded sales from 34 of 34 districts over the last 12 months.
5097 found · 5097 imported · HTTP 200 · 10 Nov 2026
774 live listings across 34 of 34 city pages.
700 found · 37 imported · HTTP 200 · 10 Nov 2026
941 live listings across 34 of 34 city pages.
700 found · 0 imported · HTTP 200 · 10 Nov 2026