← All citiesCheck a rental yield 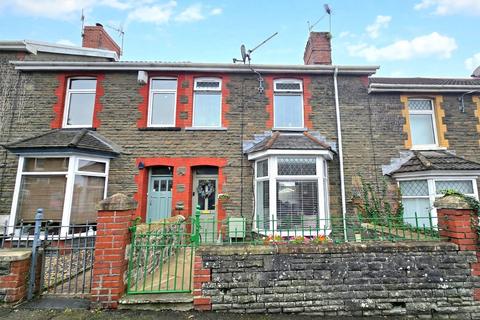 OnTheMarket
 OnTheMarket
 OnTheMarket
 OnTheMarket
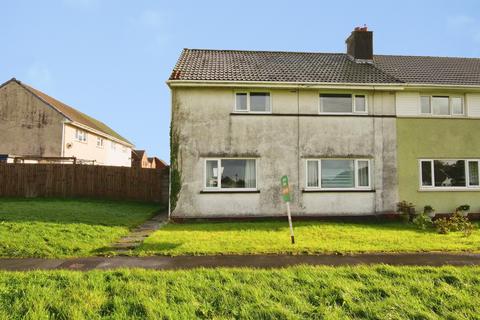 OnTheMarket
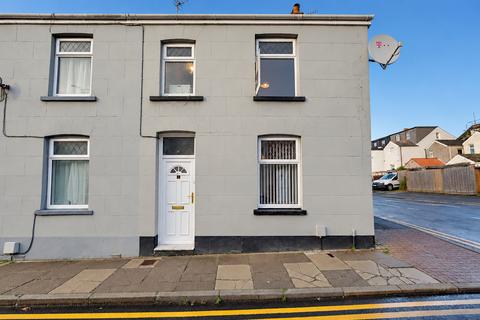 OnTheMarket
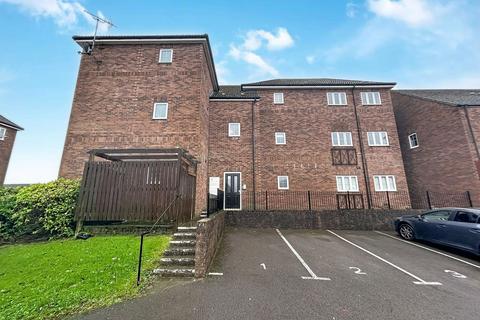 OnTheMarket
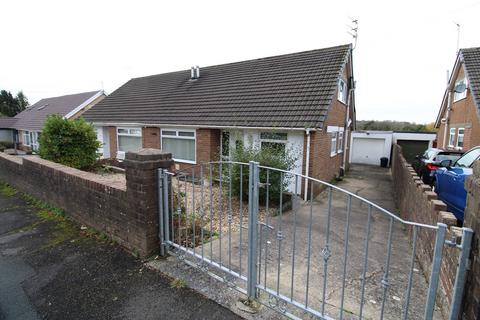 OnTheMarket
 OnTheMarket
North EastCity centreSuburban
Newcastle
Rising market, 2.2% over the last 12 months.
12-month movement
-7.7%
Investment snapshot
Key metrics for Newcastle
Median asking price
£210,000
51 homes listed
Average £ / sq ft
£223
Asking price, size adjusted
Average sold price
£224,000
150 sales recorded
12-month movement
-7.7%
Median asking price
Median time to offer
144 days
From first listing
Population growth
+7.1%
300,000 residents · 2011–2021
Asking prices are live portal data; sold prices are recorded completions from HM Land Registry. Population growth uses the 2011 and 2021 Censuses.
By bedroom count
Price history
median asking priceSold prices
Completed sales recorded by HM Land Registry, free open data
£185,000
median sold price
Sales
150
Average
£224,000
Window
21 Aug 2026 – 30 Sept 2026
Semi-detached · £197,000 · 49
Terraced · £158,000 · 49
Flat · £155,000 · 34
Detached · £377,500 · 16
Other · £186,500 · 2
- Walwick FellNE15 6BT · Detached · 30 Sept 2026£212,000
- SunnywayNE5 3QB · Flat · 30 Sept 2026£117,500
- Sandyford ParkNE2 1TA · Flat · 25 Sept 2026£95,000
- St Peters WharfNE6 1TW · Flat · 25 Sept 2026£190,000
- FaldonsideNE6 5UH · Flat · 25 Sept 2026£180,500
- Lesbury RoadNE6 5LB · Semi-detached · 25 Sept 2026£640,000
Source: HM Land Registry Price Paid Data. Sold prices are actual completions, not asking prices.
Latest in Newcastle
See allOnTheMarket£260,000
3 bedroom terraced house for sale
Newcastle
3 bed1 bath
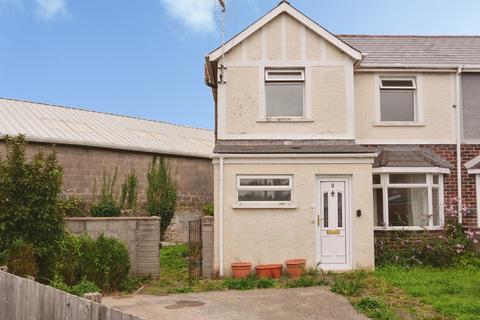
OnTheMarket£195,000
3 bedroom semi-detached house for sale
Newcastle
3 bed1 bath
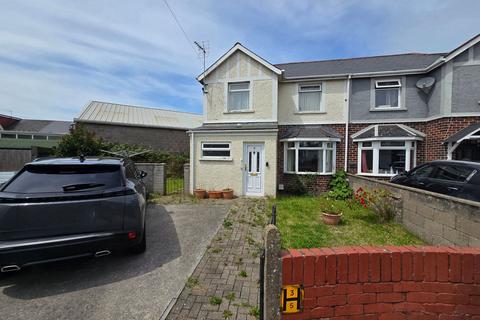
OnTheMarket£195,000
3 bedroom semi-detached house for sale
Newcastle
3 bed1 bath
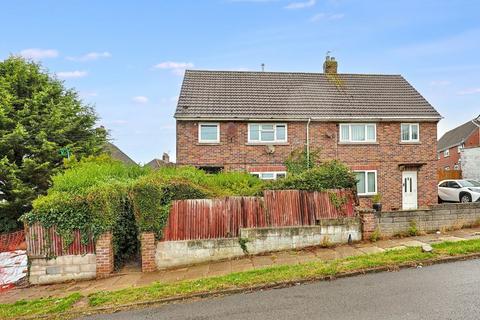
OnTheMarket£105,000
3 bedroom semi-detached house for sale
Newcastle
3 bed1 bath
OnTheMarket£180,000
3 bedroom semi-detached house for sale
Newcastle
3 bed1 bath
OnTheMarket£160,000
3 bedroom end of terrace house for sale
Newcastle
3 bed2 bath
OnTheMarket£127,000
2 bedroom flat for sale
Newcastle
2 bed1 bath
OnTheMarket£239,995
3 bedroom semi-detached bungalow for sale
Newcastle
3 bed1 bath
OnTheMarket£195,000
2 bedroom terraced house for sale
Newcastle
2 bed1 bath